

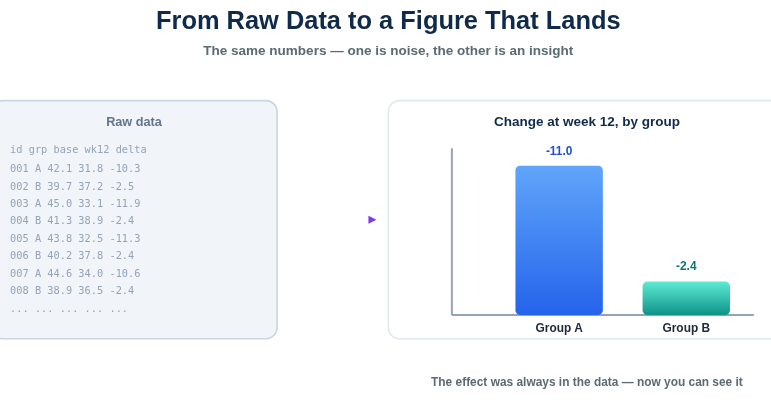
A Finding No One Can Read Is a Finding Wasted
You can run the perfect analysis and still lose the room with a cluttered figure, a misleading axis, or a chart that buries the one result that mattered. A good visualisation does the opposite: it makes the finding obvious in seconds, survives peer review, and stays honest to the data. That is a skill that sits between statistics and design and it is the one we provide.
At StatsCure Network, our biostatistics and visualisation experts turn complex datasets into clear, accurate, publication-ready figures, dashboards, infographics, and visual reports for researchers, healthcare organisations, pharmaceutical companies, CROs, and academic institutions. Publication, clinical study report, thesis, conference, regulatory submission, or board deck we present your findings so they read clearly and stand up to scrutiny.
underneath, so every figure is both compelling and correct.
The gap between a spreadsheet and an insight is design done with statistical judgement. The
wrong chart can distort a true result; the right one makes it unmistakable. We pair visual craft
with the statistics
We design the full range of research and healthcare visuals:
Every visualisation is shaped around your objective, your audience, and where it will be seen.
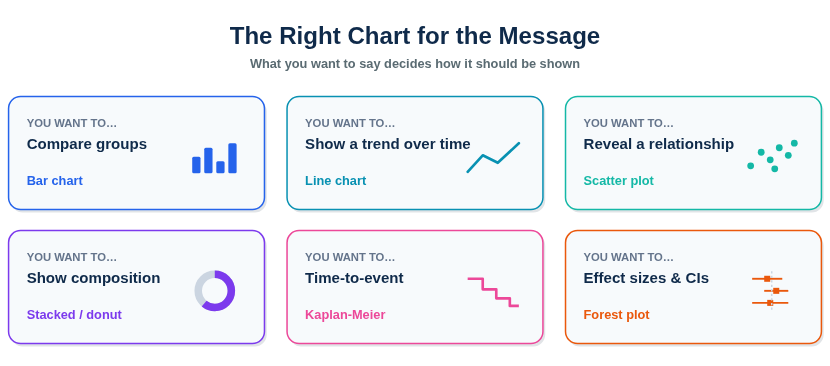
Every deliverable is built for clarity, accuracy, and visual impact.

A chart is not decoration — it is an argument made visible, and a careless one misleads. Our work rests on the statistics as much as the design:

Most visualisation is done either by designers who do not know the statistics or by analysts who cannot make a figure speak. We do both. Clients choose us for:
Alongside data visualisation, we also offer statistical data analysis, study design consulting, sample size estimation, medical writing, manuscript writing, and real-world evidence research.
The analysis is only half the job the other half is making the result land. Whether you need
publication-ready figures, interactive dashboards, or research graphics, we will help you present
your data with clarity and confidence.
Contact StatsCure Network today to discuss your data visualisation requirements and turn
complex findings into visuals that speak for themselves.